This is an expanded version of an answer I wanted to give over at Doug’s website to the question of how do you judge improvement in functional ability with aging. Specifically, Ed is almost 69 but feeling really solid about his strength. The exchange:
“Another Point: Folks, don’t fool yourself into thinking you’re “stronger” after 5 Years of aging – one might perform exercises better or score well on machines, but age Kicks Your A**”
Not sure I agree. I firmly believe that I’m as close to defying the aging process as could happen. Between 61 and 63 my measurable strength levels went up about 60-70% (despite “working out” with weights for 20 years prior…I had a good start). Going on 69 and they have not dropped one bit. So that said, in the last 5 years I’ve seen no decline in what I accomplished the first 2 years. Which says to me, I’m just as strong now as I was 5 years ago (not to mention I feel fantastic!)
The other trainer basically waves off Ed’s statement by saying he’s “keeping score on machines” and implies that a barbell bench press would be the “real” scorekeeper of his strength levels. Let’s talk about this.
What the heck is strength, actually?
Or specifically, what are the ways in which our body manifests strength? People with a little experience in this field understand that it’s not *just* muscle mass being added. There’s a whole host of compensatory mechanisms being used to make one “stronger” without a corresponding increase in size.
In Neuromechanics of Human Movement, Roger Enoka (the author) lists eight potential neurological areas for non-hypertrophy related strength gains:
- Enhanced output from supraspinal centers (which they show from simply imagining muscle contractions)
- Changes in descending drive that reduce the bilateral deficit (the inability to fully recruit all of the motor units during dual limb compound movements)
- Increased motor unit synchronization
- Greater muscle activation (EMG)
- Heightened excitability and altered connections into motor neurons
- Reduced coactivation of antagonist muscles
- Greater activation of agonist and synergist muscles
- Enhanced cross-education
Big list, but the important component is that basic coordination between the muscles is the single greatest contributor to non-hypertrophy related strength gains. Along with neurological adaptations, adaptations involving increased stiffness in the tissues that connect from bone to bone (tendons, extracellular matrix, etc.) can lead to increased force transmission from muscle to bone, which play a significant role in increased strength gains. The more “spring-like” the tissue can become, the more the force produced ends up moving through the barbell or apparatus attempting to be moved.
So in that sense, the trainer talking about keeping “score” with machines (or any exercise) is correct: they can lie to you. However, it’s important to note that these mechanisms cannot compensate forever. Imagine if they could: you’d be the 98lb weakling dead lifting 800lbs. Rather, these compensations occur in parallel with hypertrophy and within parameters. Eventually the compensatory ability reaches its ceiling for a given amount of muscle mass and you either add tissue or, if you’re near your genetic limit, don’t get any stronger or bigger. Such is life. But the take away is that if you’re getting stronger and your weight is stable, you’re probably not losing muscle. This measure is directionally accurate.
So how else can you keep score?
Body composition
Let me remind you that Ed is nearly 69. He’s on the downward slope of muscle mass and strength gains, where his peers are withering. Ed is making progress due to their rapid loss of tissue due to inactivity and sudden fat increase, a term called “sarcopenic obesity.” A great review of this can be found here.
From a visual perspective, this curve can be displayed. Here’s how it looks based on the literature:
 The original curve is from “Bending the Aging Curve” by Joseph Signorile. I added the “Paddon-Jones” curve, as one of Dr. Paddon-Jones former students was a muscle physiologist at Texas State University (where I received my masters). She explained that the original curve doesn’t account for the fact that people get injured, lose a lot of mass, and never recover to a “normal” projected loss. So the “gap” between a good functioning person training and their sedentary peers is even larger.
It looks great on a graph, but something more substantial is required. How about images?
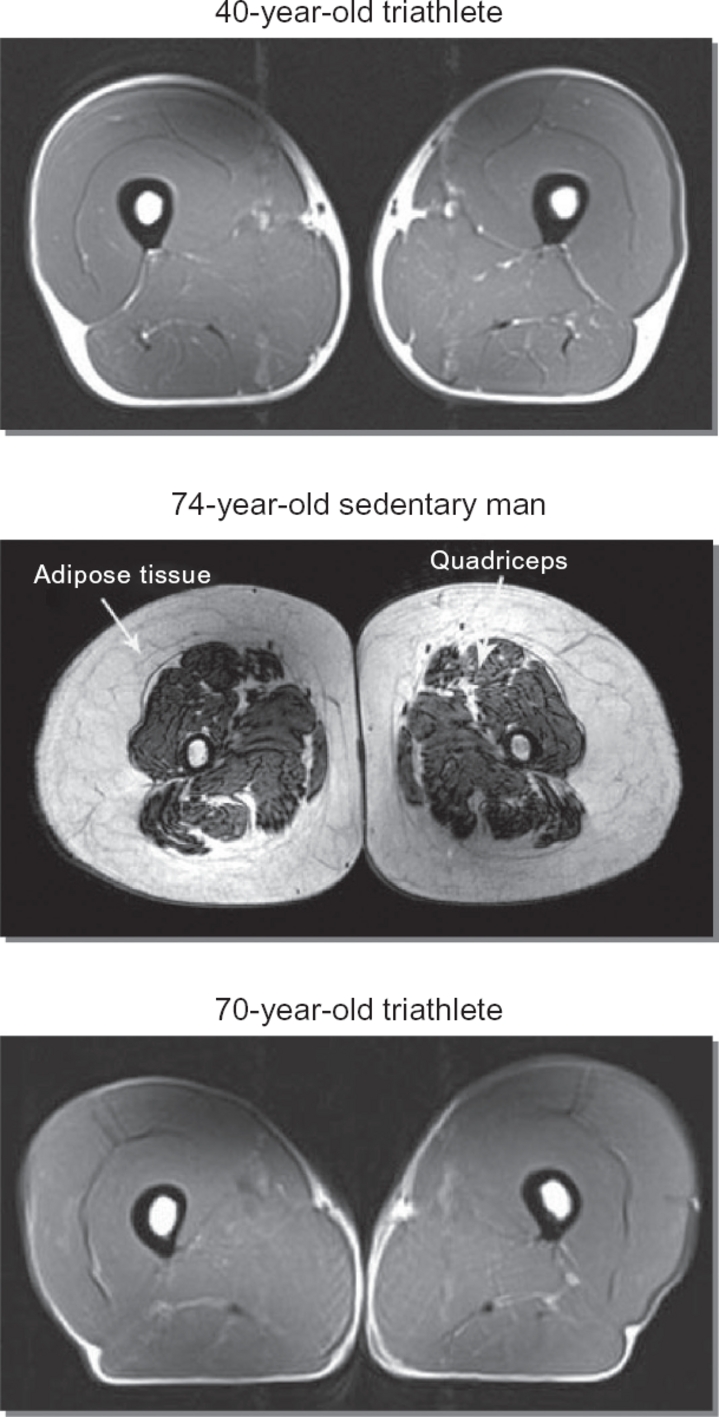 The 40 year old and 74 year old triathlete look nearly identical as far as muscle mass are concerned. Remember it is the total volume of tissue we’re looking at here; it’s difficult to sometimes see how a person actually is doing when they’re aging because of the breaking down of the collagen matrix in their skin making them look less “hard” than when they were younger. The muscle is there, but the skin lies a bit.
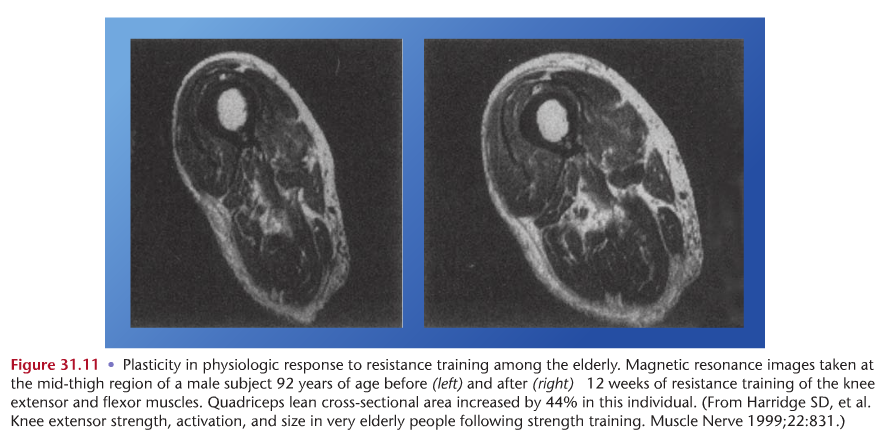
Ed notes substancial strength and tissue gains in his early 60’s. We see these improvements in sedentary 90+ year olds. It looks like this:
 Based on the above, it is reasonable to assume that one could “jump” a line if training is sufficient in intensity and progression. Perhaps this explains Ed’s jump in strength and maintenance thereof.
Another point: muscle is an endocrine organ. High quality work with muscle stimulates a more youthful expression in all of the organ systems in the body. It is literally the gatekeeper to youth.
Takeaways
- Strength is a directionally accurate indicator of lean tissue maintenance and/or gain during aging.
- Decay is inevitable but the rate of decay is largely within your control.
- The surest way to “keep score” of your physical function throughout aging is a yearly DXA scan to assess muscle and bone, a basic mobility screen, and strength as assessed by your training regimen. All of this with feeling really damn good covers both objective and subjective measures of physical function.
